Portfolio

Selected work with embedded demos and dashboards. (If an embed is blocked, use the “Open” button.)

🧠 AI Applications

Live demos + code.

Scientific Literature RAG Assistant

React + FastAPI + PostgreSQL/pgvector + AWS Bedrock

Portfolio-quality research intelligence app for searching scientific PDFs, synthesizing evidence, inspecting page-level citations, and discovering corpus research themes.

RAGFastAPIReactpgvectorBM25AWS BedrockScientific AI
Scientific Literature RAG Assistant

Open

If the embed is blank, it’s likely blocked by the provider’s security headers. Use Open to view it directly.

AI Digital Twin Portfolio Assistant

Next.js + FastAPI + AWS Bedrock

Personal AI assistant trained around my resume, projects, and professional background, with a static portfolio frontend and cloud-ready backend.

Next.jsFastAPIAWS BedrockTerraformLLM App

ML Classification Pipeline

GridSearch + Streamlit

End-to-end ML workflow for preprocessing, training, tuning, and evaluation with a clean UI.

PythonScikit-learnStreamlitML Ops

Embedded Streamlit Demo (if supported)

Open

If the embed is blank, it’s likely blocked by the provider’s security headers. Use Open to view it directly.

Interactive Data Analysis App

Streamlit

Upload CSVs, run EDA, visualize correlations, and fit regression models with metrics.

PythonEDAPlotlyStreamlit

Embedded Streamlit Demo (if supported)

Open

If the embed is blank, it’s likely blocked by the provider’s security headers. Use Open to view it directly.

CarMax Analytics

ML + Streamlit + BI

Interactive analytics + ML to understand appraisal signals and predict customer switching behavior.

PythonRandom ForestStreamlitBI

Embedded Streamlit Demo (if supported)

Open

If the embed is blank, it’s likely blocked by the provider’s security headers. Use Open to view it directly.

Demo Walkthrough (Loom)

Open

If the embed is blank, it’s likely blocked by the provider’s security headers. Use Open to view it directly.

📊 Data Science & Analytics

Interactive dashboards and BI work.

Google Fiber Repeat Caller Analytics

Tableau Dashboard

BI dashboard to identify repeat-call drivers and market patterns for operational improvement.

TableauAnalyticsETLStorytelling

Embedded Tableau Dashboard

Open

If the embed is blank, it’s likely blocked by the provider’s security headers. Use Open to view it directly.

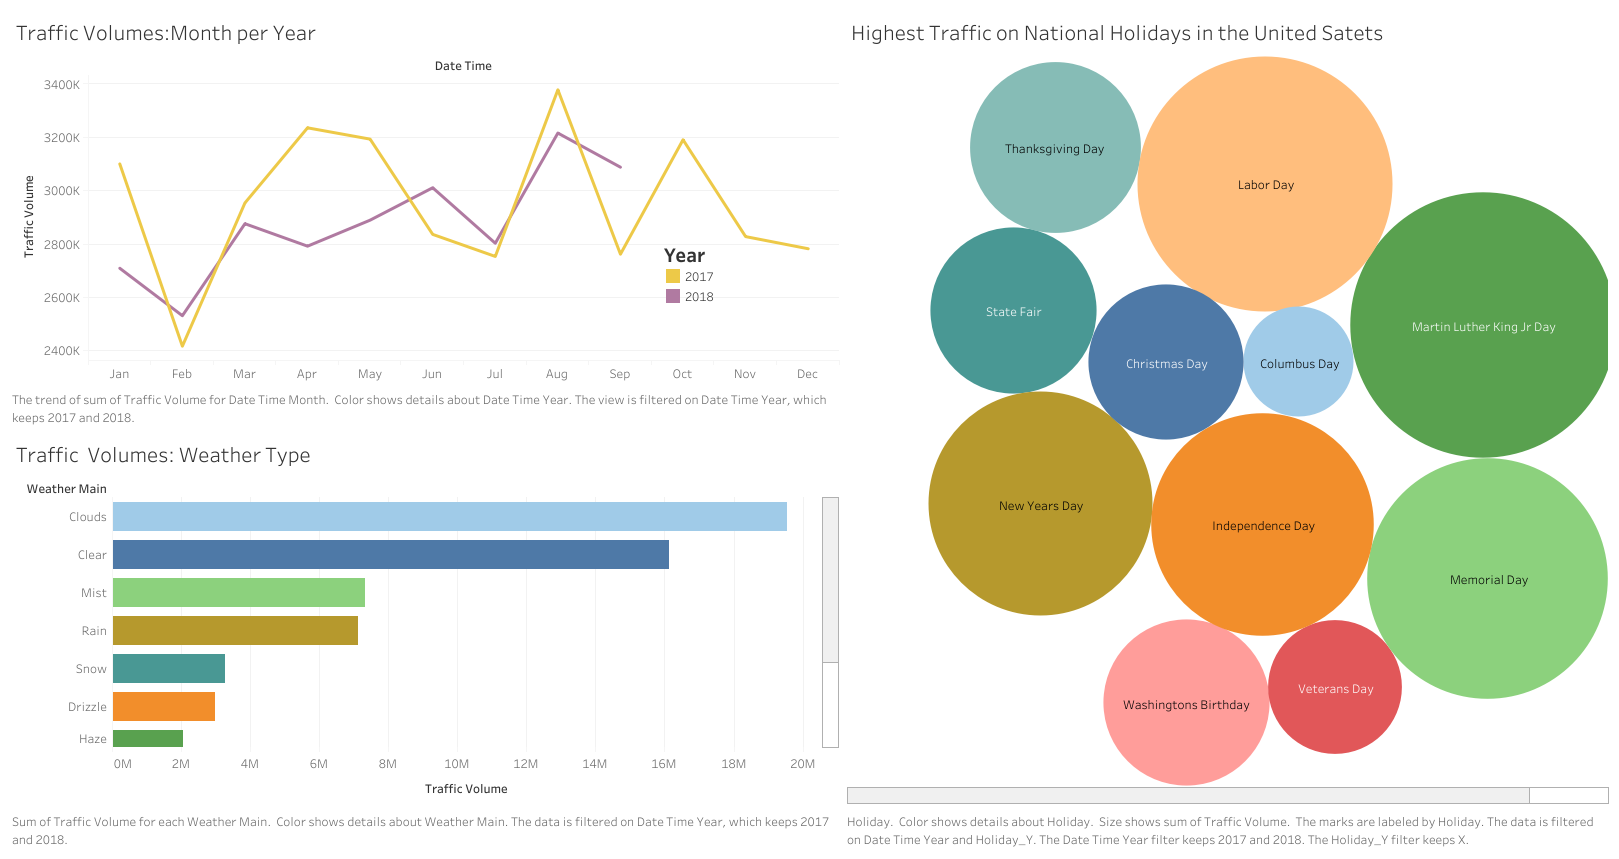
Minnesota Interstate Traffic Volume

Tableau + Executive Report

Trend analysis across time, holidays, and conditions with an executive-ready narrative.

TableauEDAVisualizationExecutive Reporting

Embedded Tableau Dashboard

Open

If the embed is blank, it’s likely blocked by the provider’s security headers. Use Open to view it directly.

Dashboard Preview

Open
Minnesota Interstate Traffic Volume dashboard preview

📚 Research & Notebooks

Papers and technical write-ups.

Optimizing Landslide Susceptibility Mapping

Peer-reviewed Paper

Ensemble ML evaluation with strong predictive performance and interpretability-driven insights.

Machine LearningModel EvaluationEnsemblesExplainability

Credit Card Anomaly Detection

Notebook + Paper

Supervised + unsupervised approaches for skewed fraud data with practical evaluation metrics.

Anomaly DetectionImbalanced DataPythonModeling
© 2026 Gazali Agboola